


The first two charts reflect crude oil production and world oil consumption. The next is the Non-Opec oil production growth. Finally, there is a chart of US energy consumption by fuel. We must move away from fossil fuels/nuclear and move to clean, renewable energy resources. These charts do not reflect a strong commitment to change.
Links to flow charts: Energy, Petroleum, Natural Gas, Coal, & Electricity. Link to US emissions data and chart. Link to Energy Perspectives with data and charts.
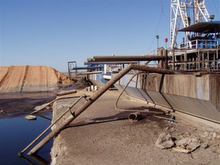
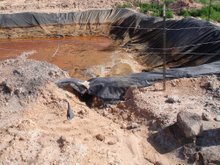
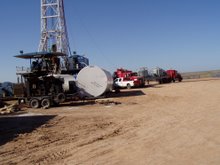
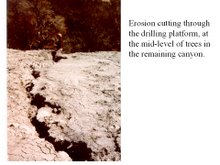
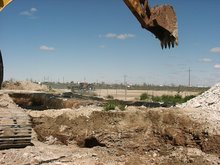
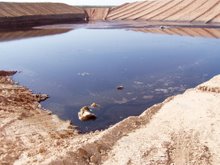
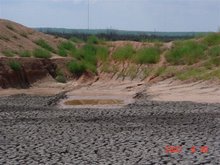
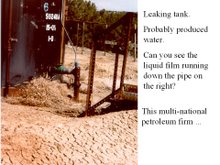
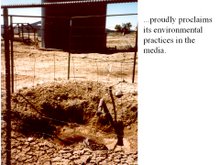
Alternative energy must become the mainstay. When it comes to resource extraction, we are in a resource death spiral. We hit peak oil, but consumption projections are forecasted to rise. Consequently, there is an unbridled race to find the last vestiges of fossil fuel -- at any cost. Land and water sources are destroyed, air polluted, people sickened, and the ecosystem endangered. Energy prices are at future shock levels. The economic system will be overloaded by such prices. Transportation costs and costs of production will rise greatly. We must hold our elected officials accountable. We must demand change.
Links to flow charts: Energy, Petroleum, Natural Gas, Coal, & Electricity. Link to US emissions data and chart. Link to Energy Perspectives with data and charts.
Alternative energy must become the mainstay. When it comes to resource extraction, we are in a resource death spiral. We hit peak oil, but consumption projections are forecasted to rise. Consequently, there is an unbridled race to find the last vestiges of fossil fuel -- at any cost. Land and water sources are destroyed, air polluted, people sickened, and the ecosystem endangered. Energy prices are at future shock levels. The economic system will be overloaded by such prices. Transportation costs and costs of production will rise greatly. We must hold our elected officials accountable. We must demand change.


No comments:
Post a Comment